DataChest
As the popularity of self-tracking increases, so do the amount of tools for it. We might track with a fitness tracker, an app on our phone, and a physical diary at the same time. When data is in different places, putting them together in one visualization can be difficult. We have to resort to spreadsheeting software, something not everyone is comfortable with.
DataChest is a
'Research-through-Design'
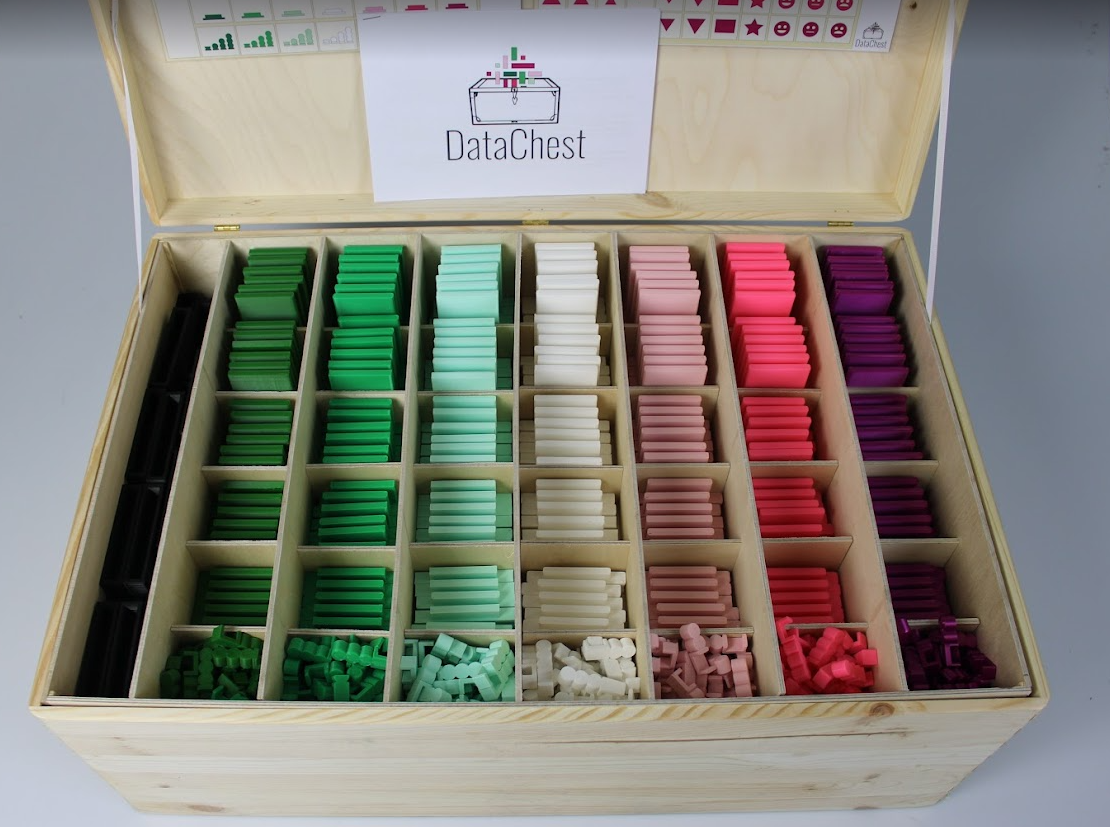
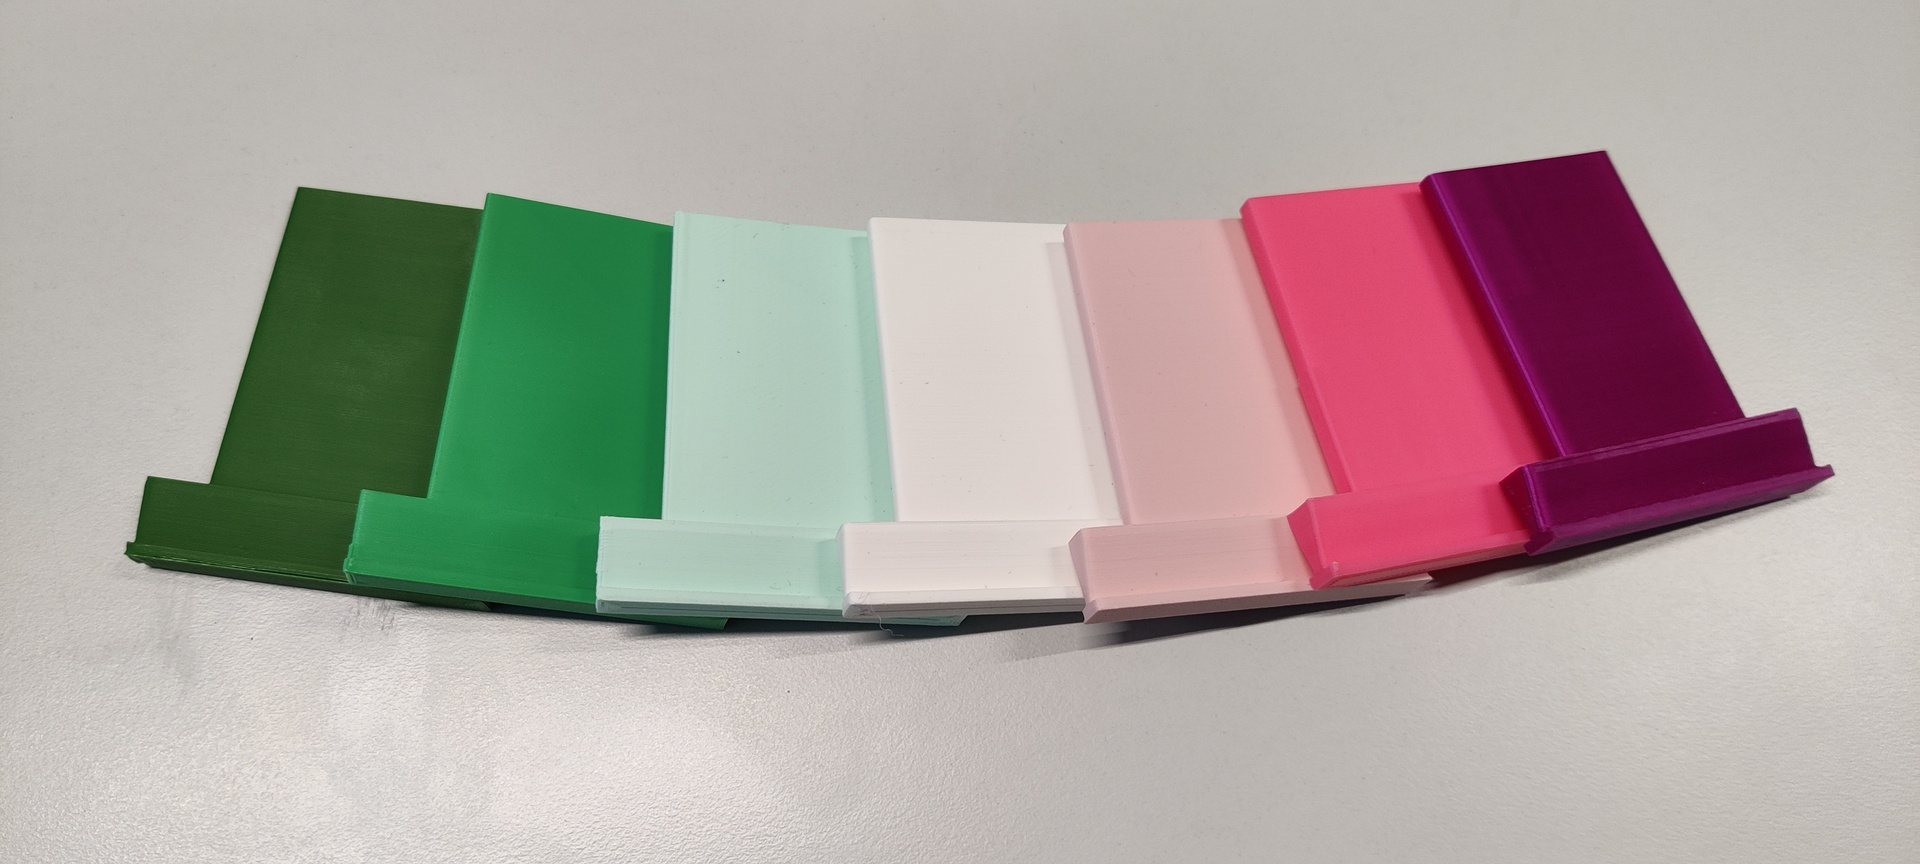
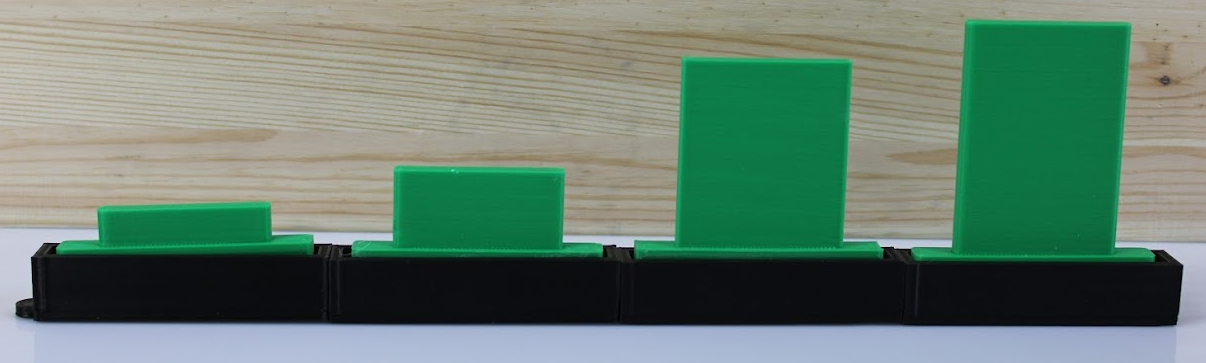
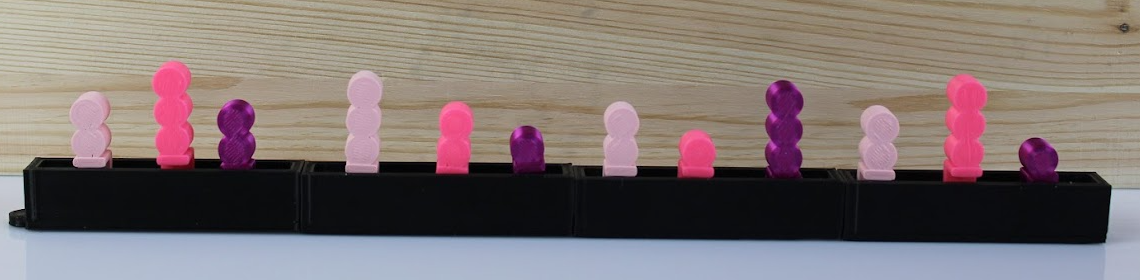
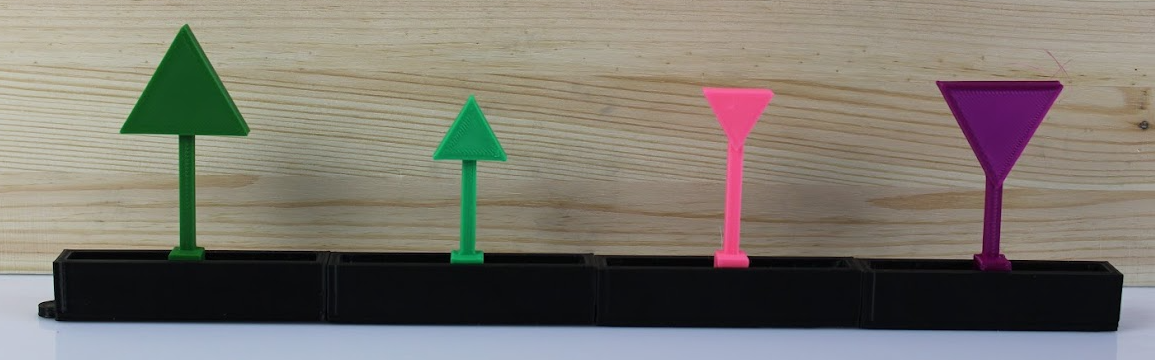
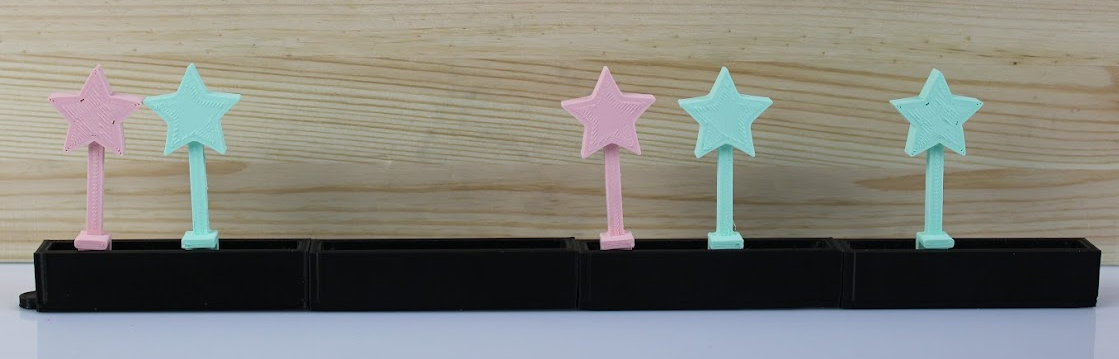
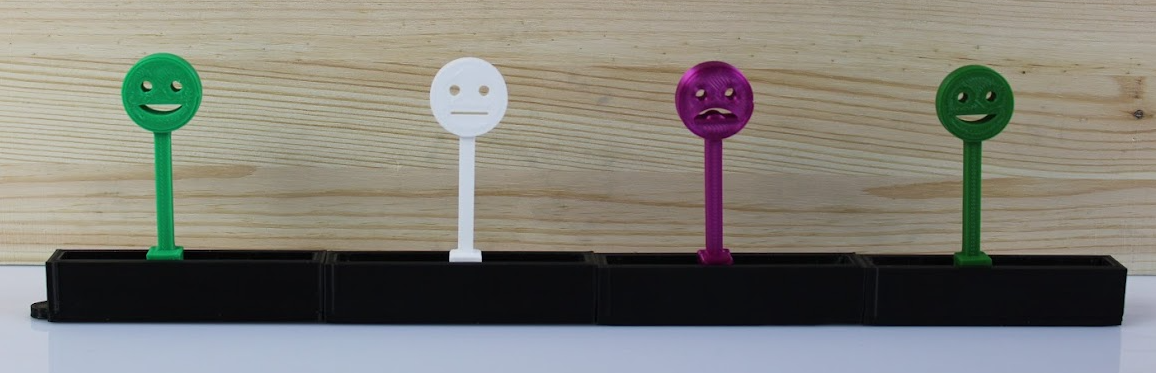
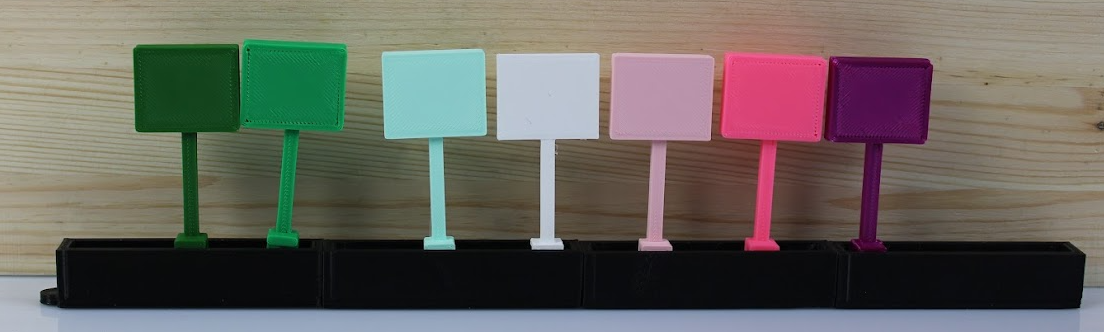
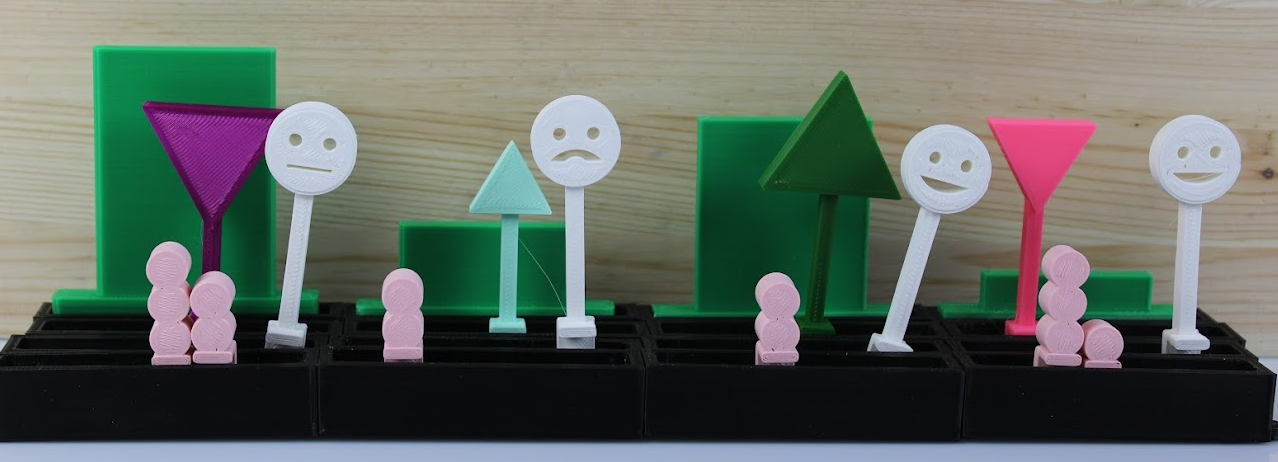
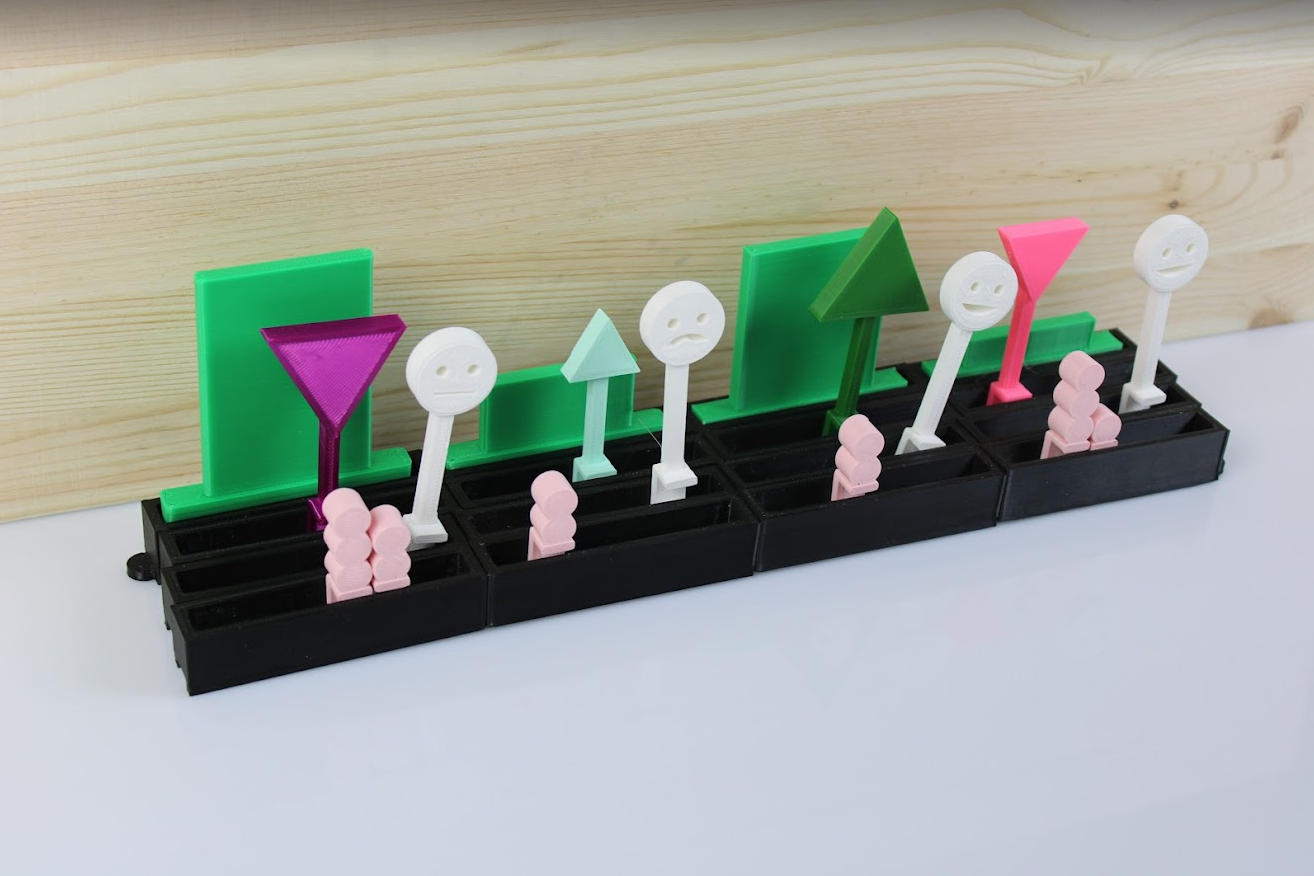
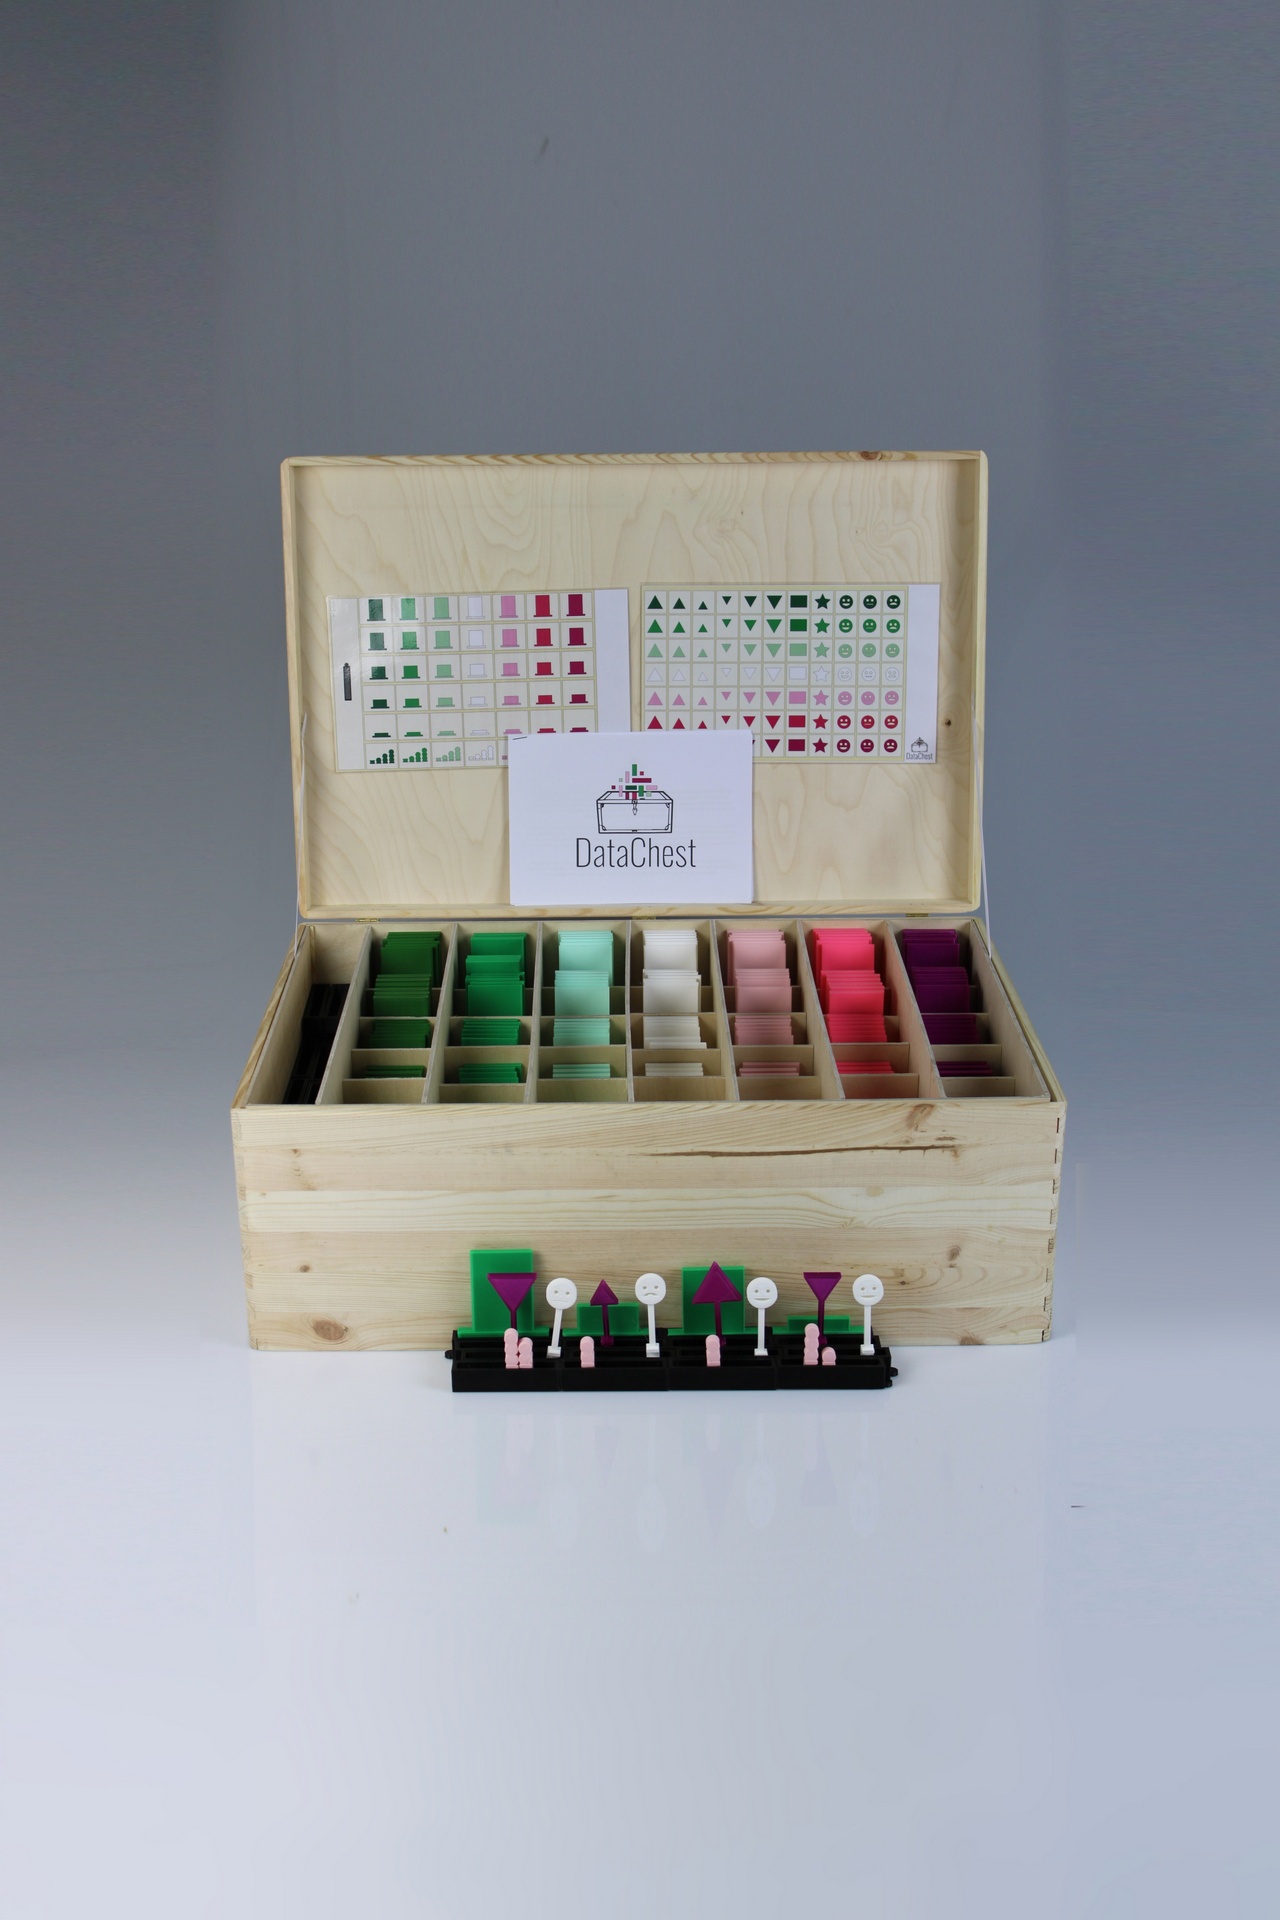
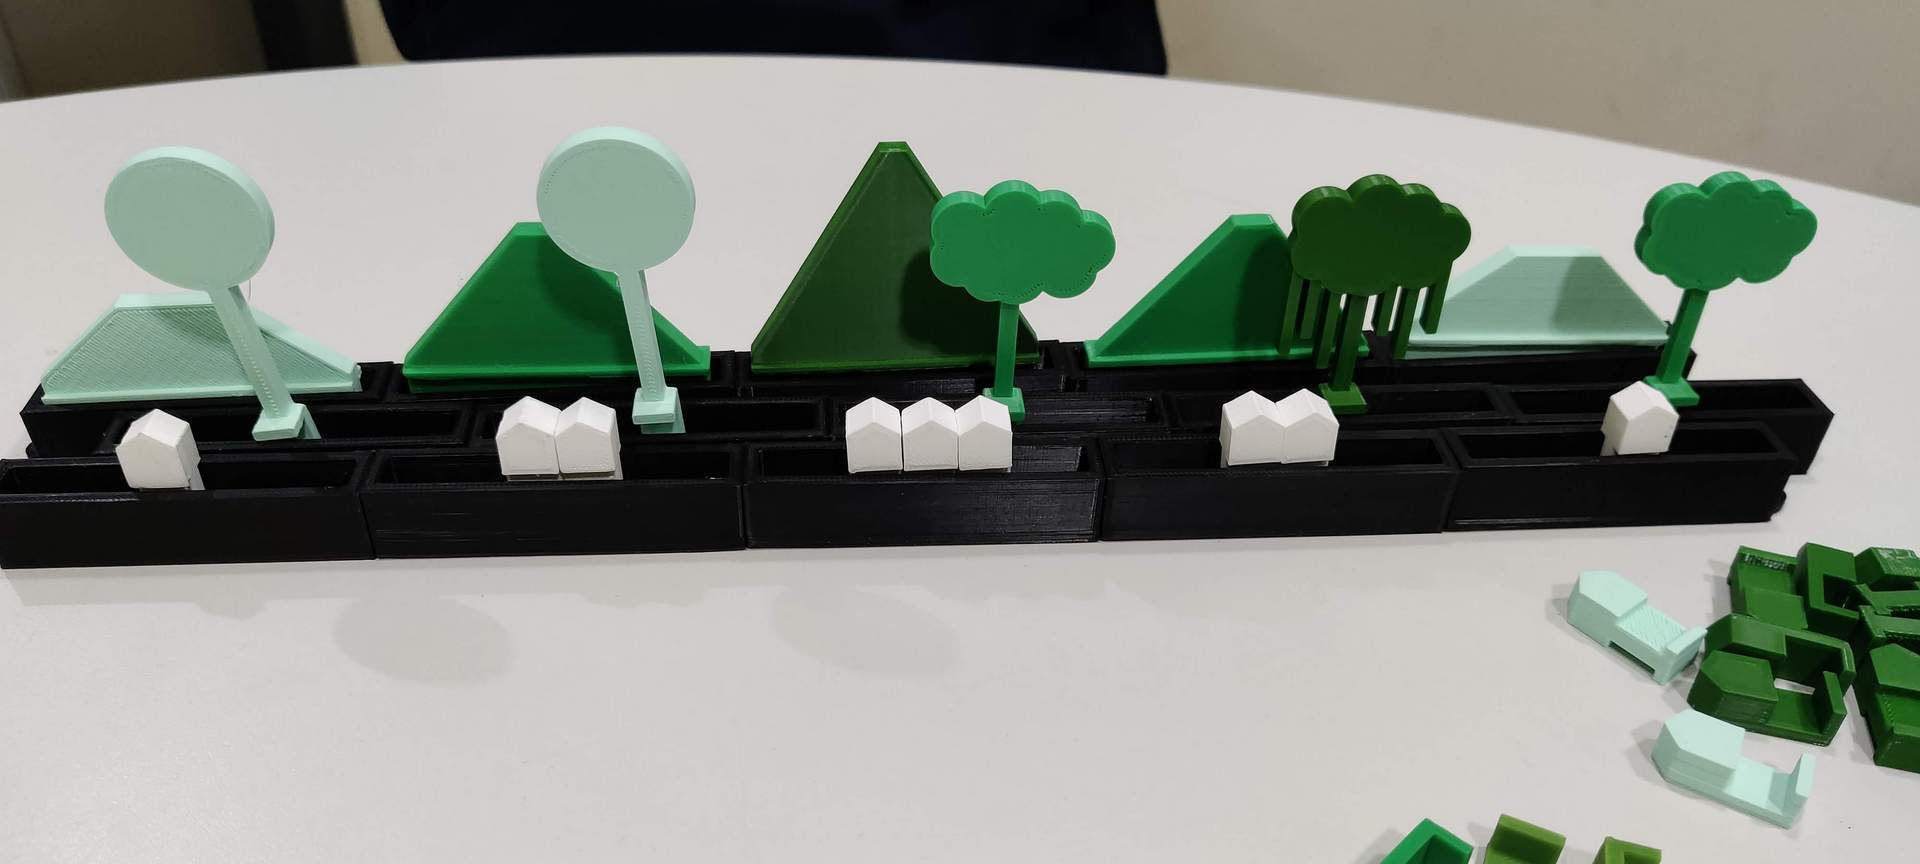
project about physical and accessible tools for personal data visualization. During the project I explored how tokens and their physical and visual aspects such as shape, size and colour can encode data and its relationships between them. The final design is a result of my findings showing the different use of colours, and differently designed tokens each with distinct purposes, forming a toolkit where users are easily able to express data and its relationships.
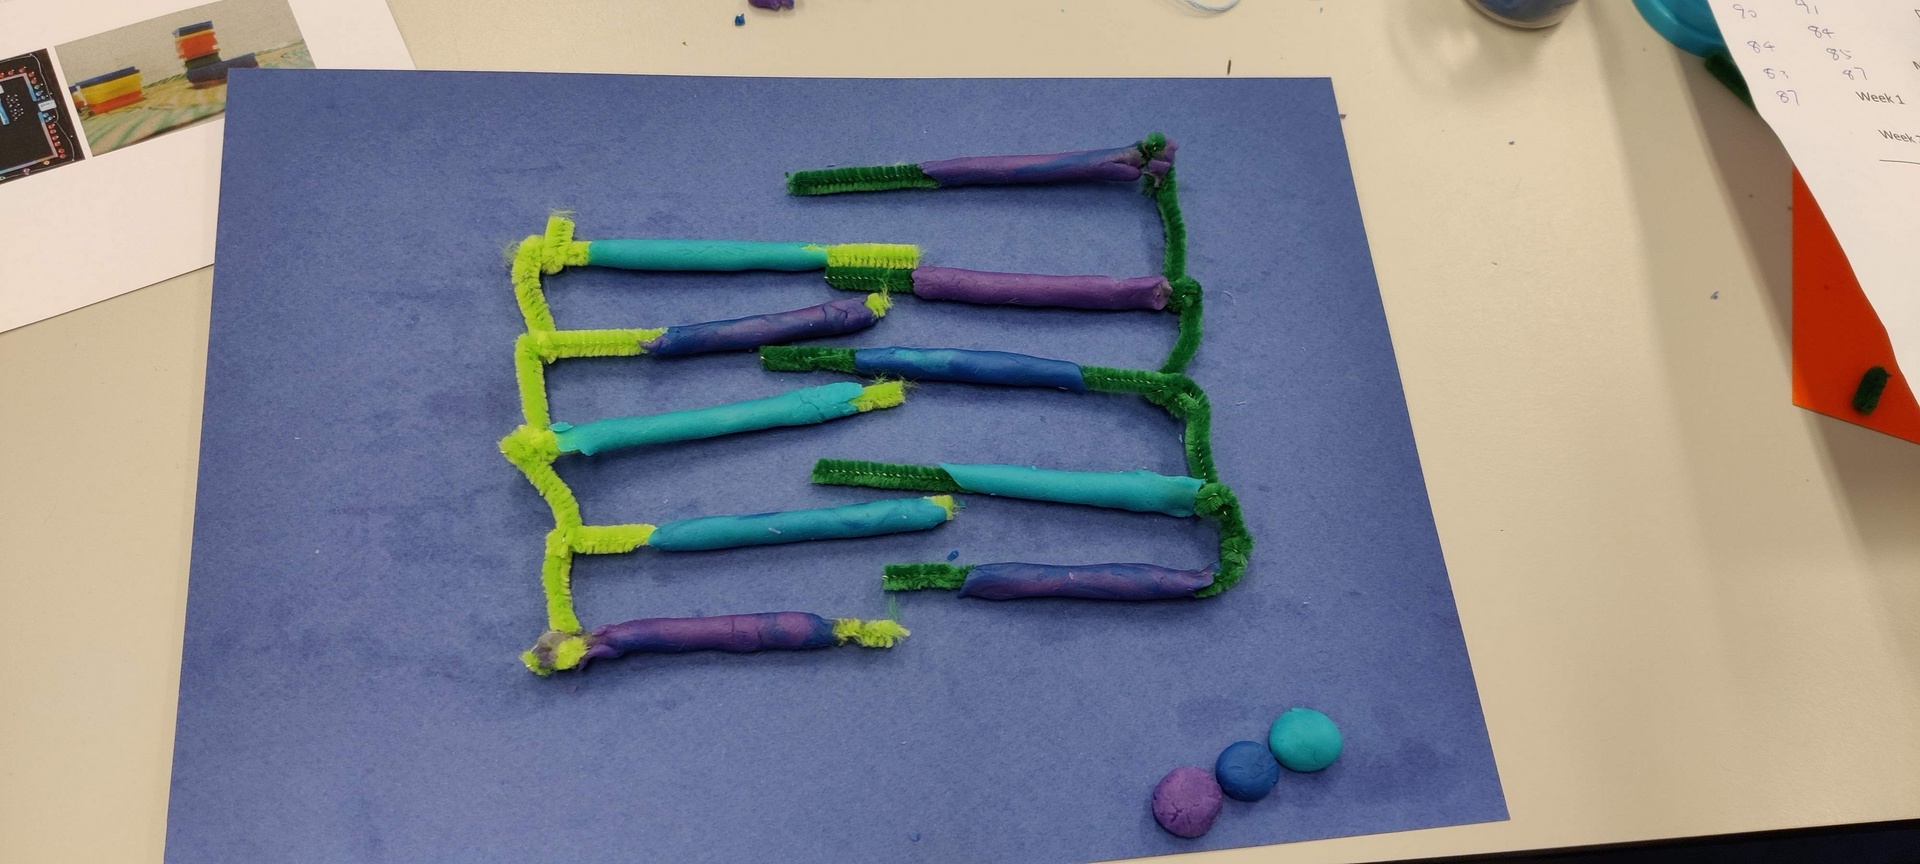
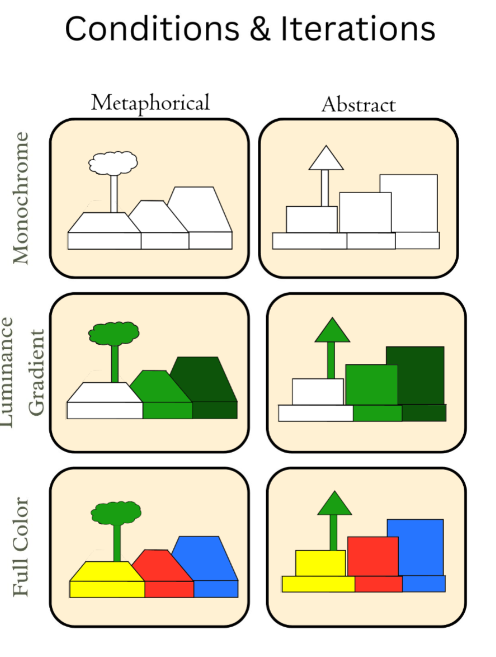
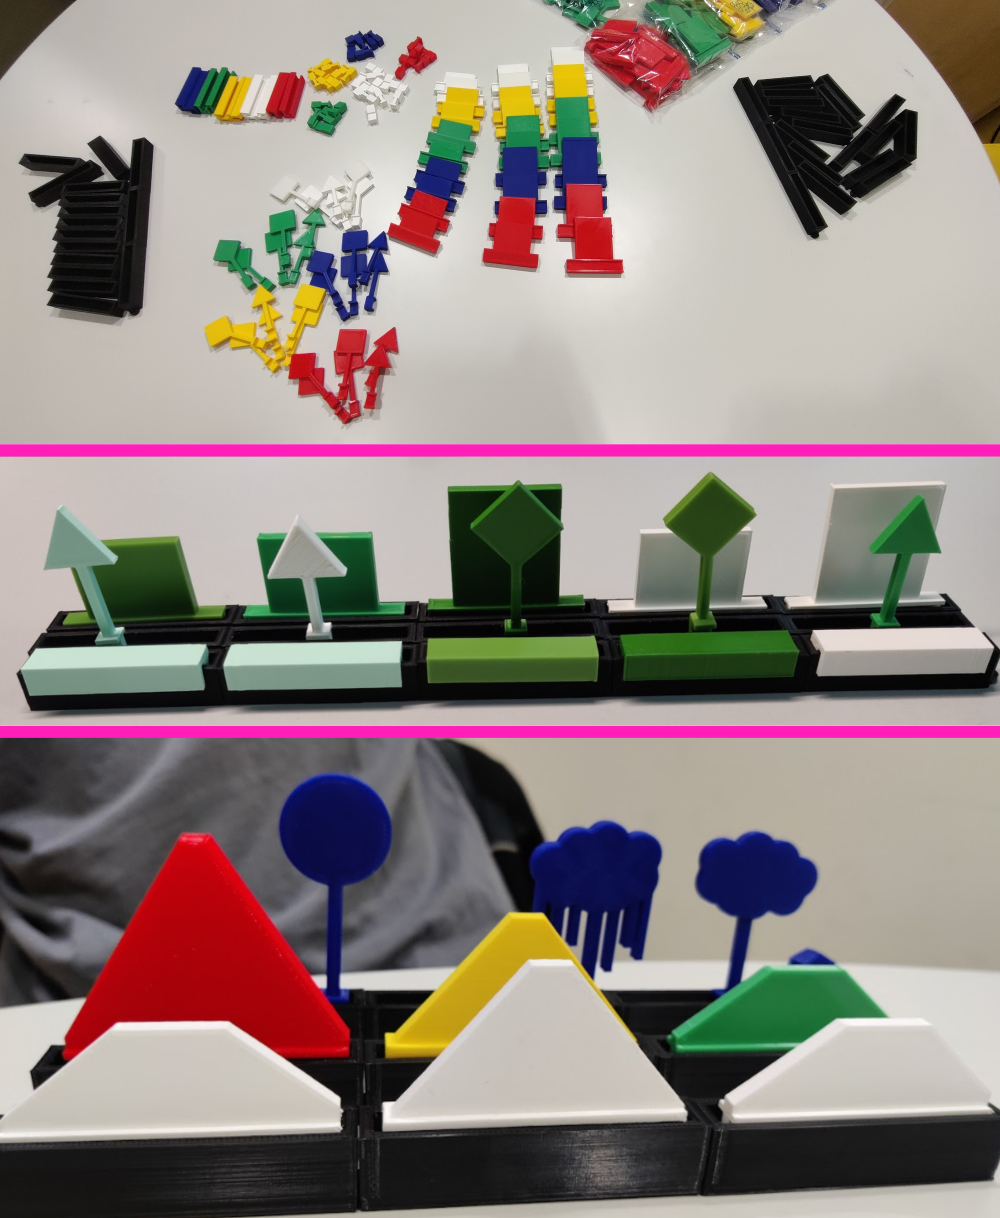
Following a preliminary material exploration where participants created visualizations, different dimensions such as the use of metaphor, colour or shape where established as key aspects to explore in the second stage.
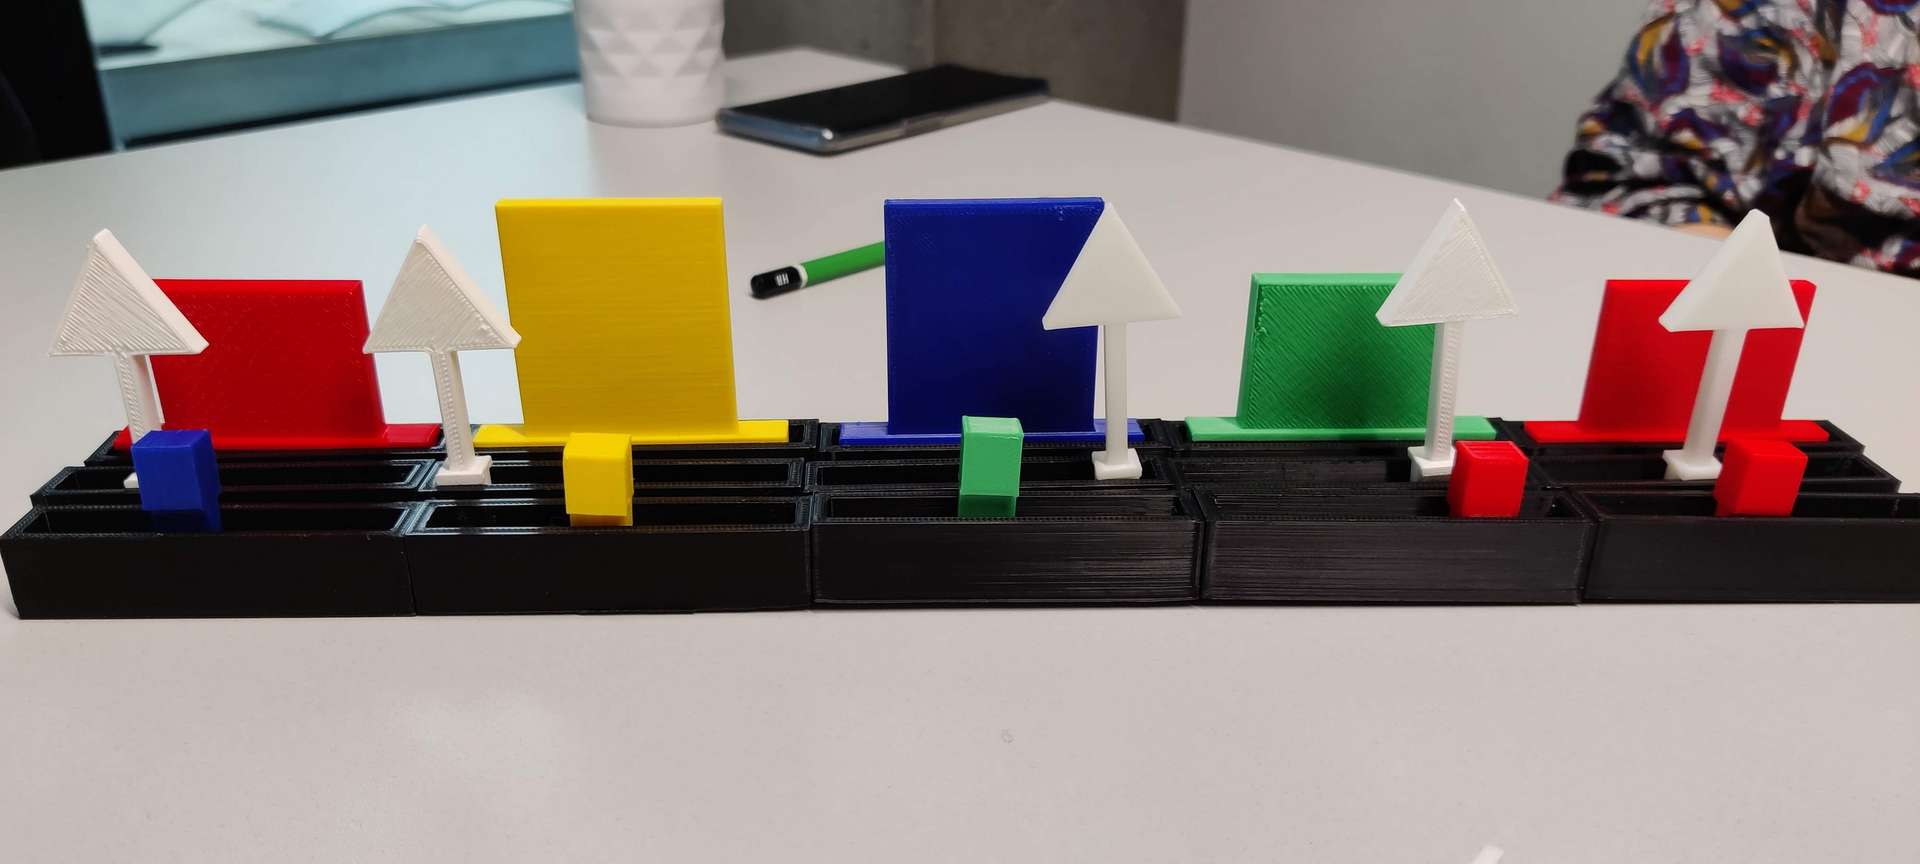
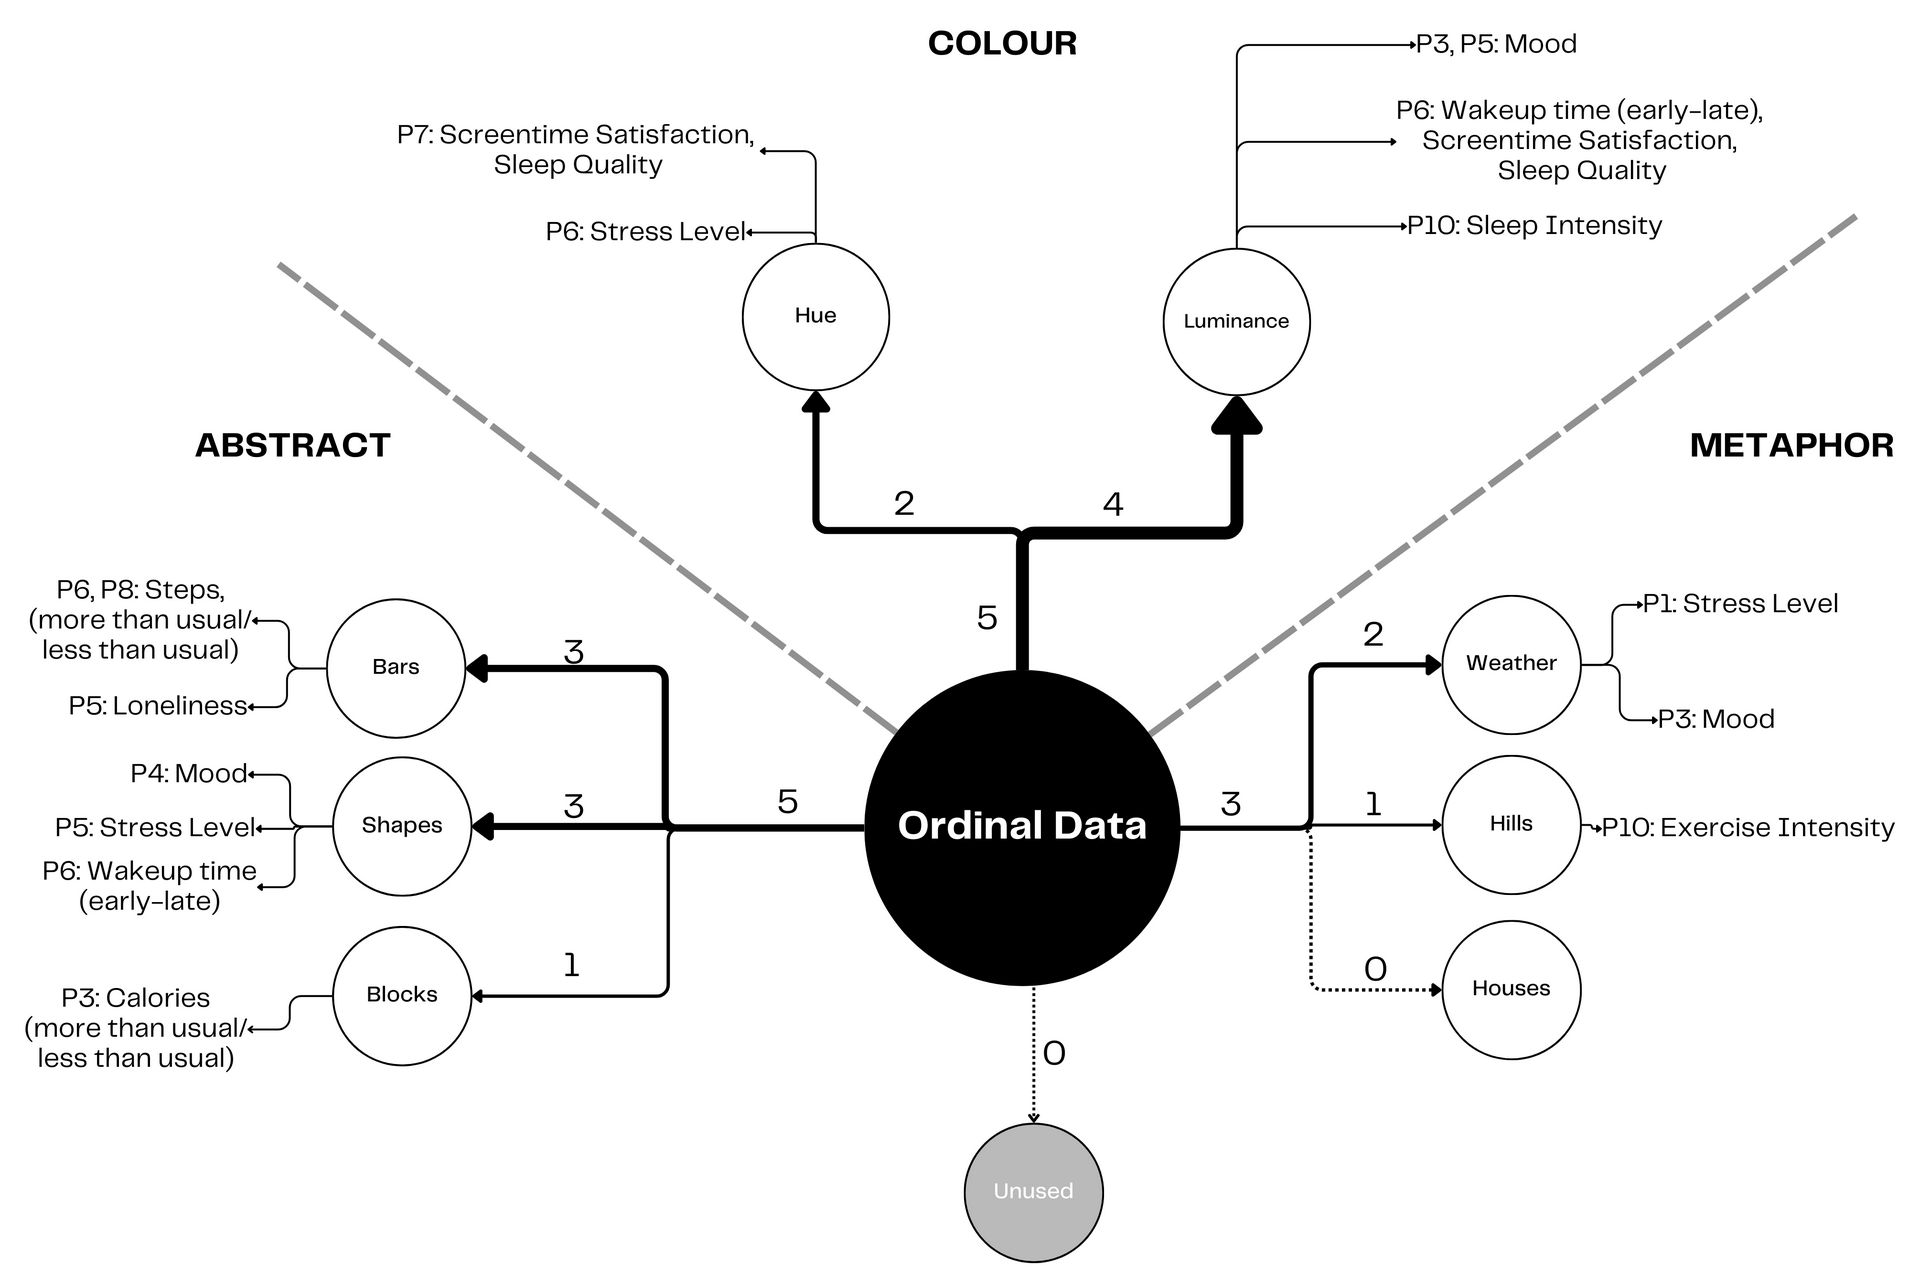
To evaluate the effect of each dimension six toolkits were created that each varied in either shape or colour. Ten participants compared different toolkits that varied in either colour or metaphor, and were interviewed about their perceptions of the different kits. Analysis of their visualizations was performed to map how each component was utilized to express a certain type of data, or to fit a perceptual function within the visualization.
Participants noted that the day-to-day build process itself and the physical presence of the visualization that provided understanding of relations between data. The resulting insights and design recommendations are represented through DataChest, a complete design including guidebook and case.
User & Society
The design provides a tangible way for people to develop their own data language and explore their data. The design is not only highly user-oriented, but also answers a need thoroughly identified by related work.
Technology & Realization
DataChest's tokens are created from self-designed 3D models and are optimized for printing speed and material efficiency by removing the need for supports during printing. Tokens are constructed to fit satisfyingly, and the project itself explores physicality and tangibility as a key component.
Math, Data & Computing
The project strongly relates to topics of data visualization, and explores new methods through a familiar lens of data types (ratio data, ordinal data etc.) that forms a key component of the analysis.
Creativity & Aesthetics
The topic involves in-depth evaluations of colour and shape, and approaches the aesthetics of tokens in addition to their practicality. The toolkit is designed to be part of the environment, and enables creativity in data visualization.
Business & Entrepeneurship
DataChest is designed to be fully realistic as an off-the-shelf product, in addition to functioning as a research tool. The including of a casing, component overview, logo, persona's and a guidebook all aim to increase the legitimacy of the design as a fully realized product.