MSc Elective Course: Data-Enabled Design
Chance-based narrative interventions for CO2 emissions of video streaming
Key Developments:
Design & Research Processes, Math, Data & Computing, Creativity & Aesthetics
This design study makes apparent the environmental consequences of video streaming in CO2, and disrupts the ‘mindless’ video streaming habits.
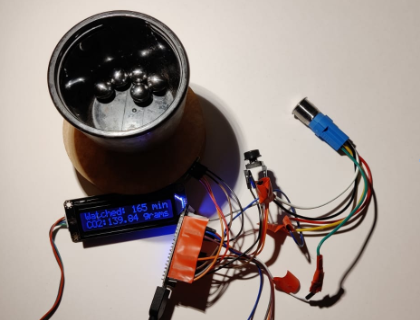
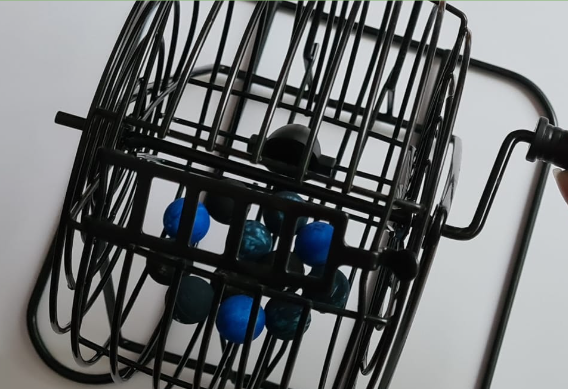
Participants 'roll' an amount of time they can stream. They record their amount watched by placing the equivalent weight of CO2 on a scale. A screen establishes how much CO2 was created through the video streaming, and how this compares to other activities such as driving a car.
The process is inspired by rich and aesthetic interactions to create a new tracking narrative surrounding video streaming. The study allowed me to explore new aesthetic self-tracking methods and new data-based design narratives that inspired my graduation project 'DataChest'.